Logs
Any build or deployment logs emitted to standard output or standard error (e.g. console.log(...)) are captured by Railway to be viewed or searched later.
There are three ways to view logs in Railway.
- Build/Deploy Panel → Click on a deployment in the dashboard
- Log Explorer → Click on the Observability tab in the top navigation
- CLI → Run the
railway logscommand
Build / deploy panel
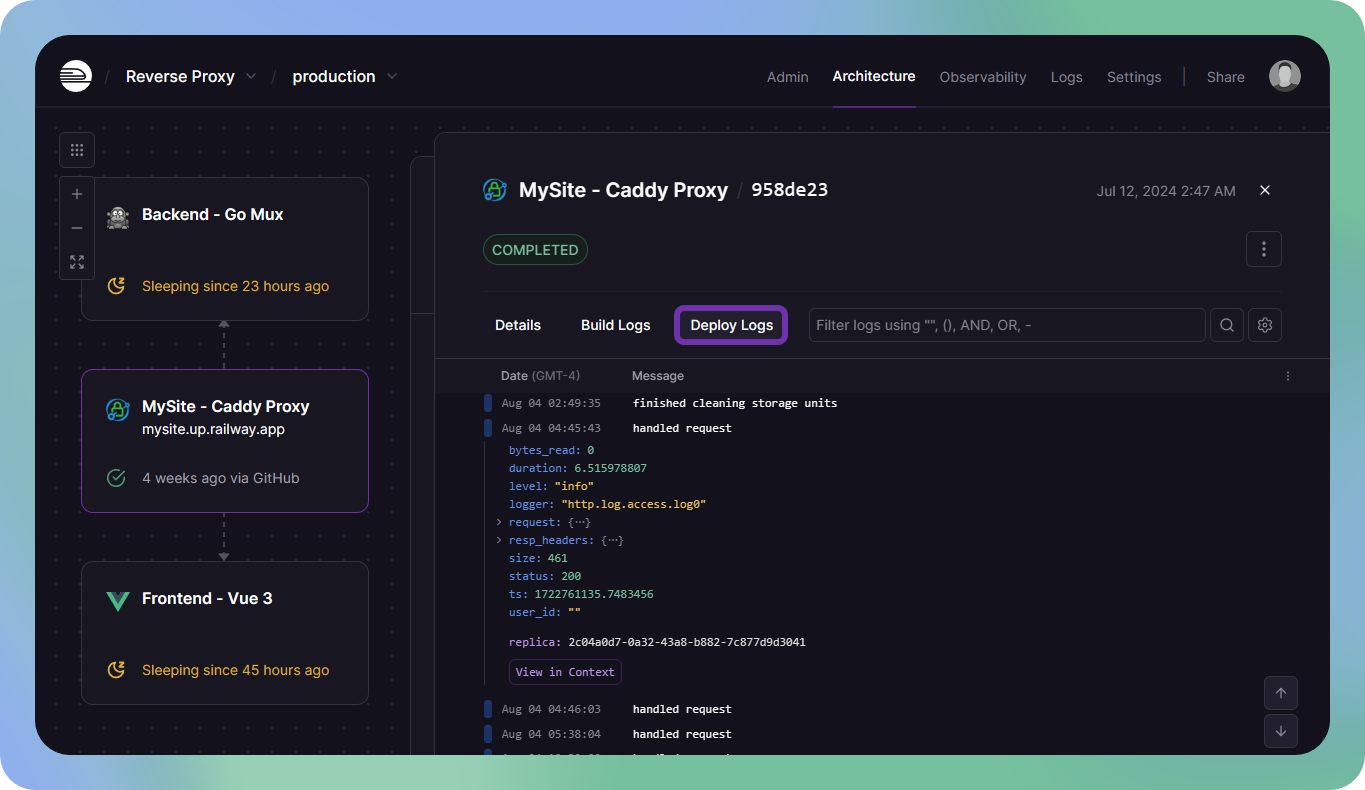
Logs for a specific deployment can be viewed by clicking on the deployment in the service window, useful when debugging application failures.
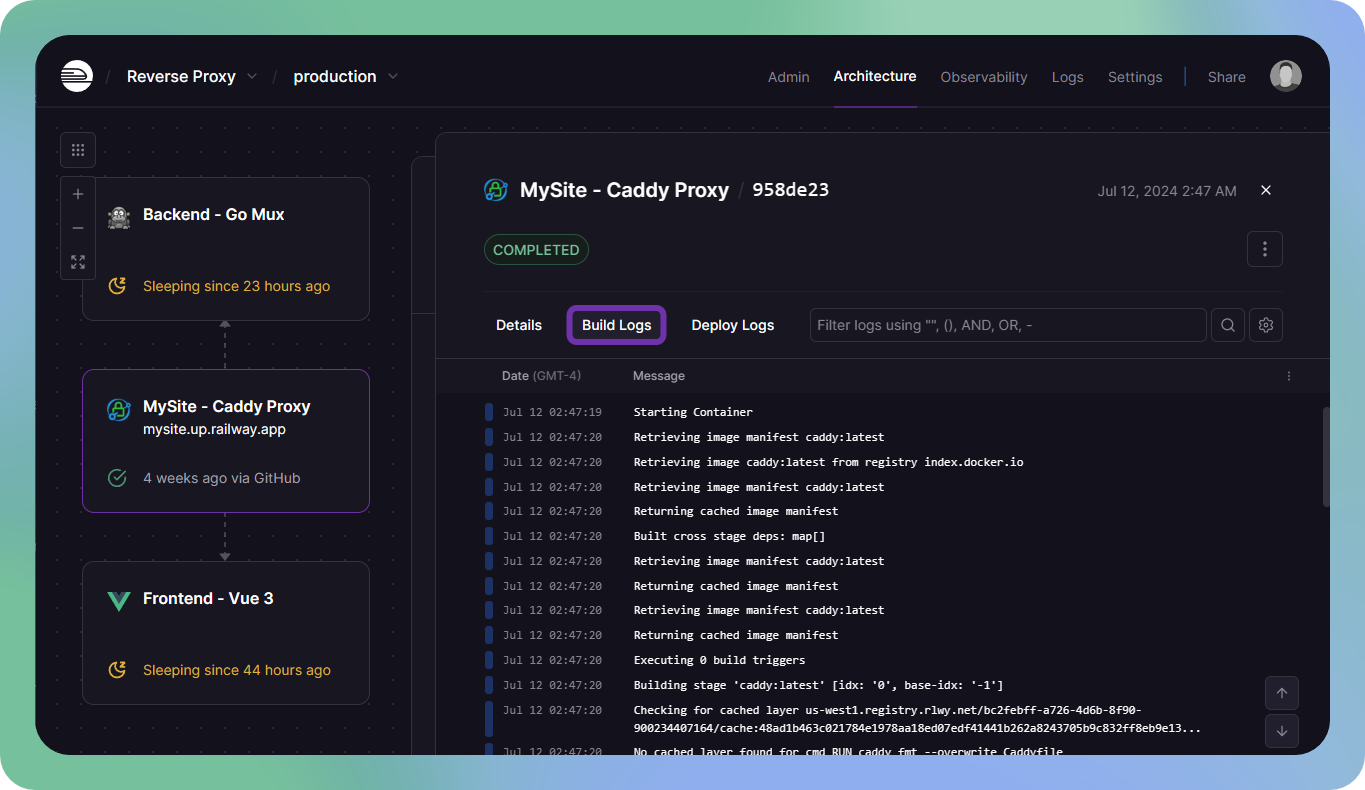
Similarly, logs for a specific build can be viewed by clicking on the Build Logs tab once you have a deployment open.
Log explorer
Logs for the entire environment can be viewed together by clicking the "Observability" button in the top navigation. The Log Explorer is useful for debugging more general problems that may span multiple services.
The log explorer also has additional features like selecting a date range or toggling the visibility of specific columns.

Command line
Deployment logs can also be viewed from the command line to quickly check the current status of the latest deployment. Use railway logs to view them.

Filtering logs
Railway supports a custom filter syntax that can be used to query logs.
Filter syntax is available for all log types, but some log types have specific attributes.
Filter syntax
<keyword>or"key phrase"→ Filter for a partial substring match@attribute:value→ Filter by custom attribute (see structured logs below)@arrayAttribute[i]:value→ Filter by an array elementreplica:<replica_id>→ Filter by a specific replica's UUID
You can combine expressions with boolean operators AND, OR, and - (negation). Parentheses can be used for grouping.
Numeric comparisons
Numeric filtering uses comparison operators and ranges, and works for deployment logs with JSON logging. It's also supported for these HTTP log attributes:
@totalDuration→ Total request duration in milliseconds@responseTime→ Time to first byte in milliseconds@upstreamRqDuration→ Upstream request duration in milliseconds@httpStatus→ HTTP status code@txBytes→ Bytes transmitted (response size)@rxBytes→ Bytes received (request size)
Supported operators:
>→ Greater than>=→ Greater than or equal to<→ Less than<=→ Less than or equal to..→ Range (inclusive)
Log type attributes
Environment logs
Environment logs allow you to query for logs from the environment they were emitted in. This means that you can search for logs emitted by all services in an environment at the same time, all in one central location.
In addition to the filters available for deployment logs, an additional filter is available for environment logs:
@service:<service_id>→ Filter by a specific service's UUID
HTTP logs
HTTP logs use the same filter syntax, but have a specific set of attributes for HTTP-specific data.
@requestId:<request_id>→ Filter by request ID@timestamp:<timestamp>→ Filter by timestamp (Formatted in RFC3339)@method:<method>→ Filter by method@path:<path>→ Filter by path@host:<host>→ Filter by host@httpStatus:<status_code>→ Filter by HTTP status code@responseDetails:<details>→ Filter by response details (Only populated when the application fails to respond)@clientUa:<user_agent>→ Filter by a specific client's user agent@srcIp:<ip>→ Filter by source IP (The client's IP address that made the request)@edgeRegion:<region>→ Filter by edge region (The region of the edge node that handled the request)
Examples
Deployment logs
Find logs that contain the word request.
Find logs that contain the substring POST /api.
Find logs with an error level.
Find logs with a warning level.
Find logs with an error level that contain specific text.
Find logs with a specific custom attribute.
Find logs with a specific array attribute.
Find tasks that take 10 minutes or more.
Find batches with more than 100 items.
Find retries between 1 and 3.
Environment logs
Filter out logs from the Postgres database service.
Filter logs from the Postgres database service and the Redis cache service.
Show only logs from the Postgres database and Redis cache services.
HTTP logs
Find logs for a specific path.
Find logs for a specific path that returned a 500 error.
Find logs for a specific path that returned a 500 or 501 error.
Find all non-200 responses.
Find all requests that originated from or around Europe.
Find all requests that originated from a specific IP address.
Find slow responses taking more than 500ms.
Find responses taking 1 second or more.
Find fast responses under 100ms.
Find responses between 100-500ms.
Find all error responses (4xx and 5xx).
Find only server errors (5xx).
Find all successful responses (1xx, 2xx, 3xx).
Find large responses over 1MB.
Find requests with body larger than 5KB.
Combine filters to find slow requests that errored.
Find slow, large responses.
View in context
When searching for logs, it is often useful to see surrounding logs. To view a log in context: right-click any log, then select the "View in Context" option from the dropdown menu.
Structured logs
Structured logs are logs emitted in a structured JSON format, useful if you want to attach custom metadata to logs or preserve multi-line logs like stack traces.
Structured logs are best generated with a library for your language. For example, the default Winston JSON format emits logs in the correct structure by default.
Logs with a level field will be coloured accordingly in the log explorer.
Logs emitted to stderr will be converted to level.error and coloured red.
Examples
Here are a few examples of structured logs.
Note: The entire JSON log must be emitted on a single line to be parsed correctly.
Normalization strategy
In order to ensure a consistent query format across Railway services, incoming logs are normalized to the above format automatically.
-
Non-structured logs are converted to
{"message":"...","level":"..."} -
log.msgconverted tolog.message -
log.levelconverted tolog.severity -
Logs from
stderrare converted tolevel.error -
Logs from
stdoutare converted tolevel.info -
Levels are lowercased and matched to the closest of
debug,info,warn,error
Log retention
Depending on your plan, logs are retained for a certain amount of time.
| Plan | Retention* |
|---|---|
| Hobby / Trial | 7 days |
| Pro | 30 days |
| Enterprise | Up to 90 days |
* Upgrading plans will immediately restore logs that were previously outside of the retention period.
Logging throughput
To maintain quality of service for all users, Railway enforces a logging rate limit of 500 log lines per second per replica across all plans. When this limit is exceeded, additional logs are dropped and you'll see a warning message like this:
If you encounter this limit, here are some strategies to reduce your logging volume:
- Reduce log verbosity in production
- Use structured logging with minimal formatting (e.g., minified JSON instead of pretty-printed objects)
- Implement log sampling for high-frequency events
- Conditionally disable verbose logging based on the environment
- Combine multiple related log entries into single messages
Troubleshooting
Having issues with logs? Check out the Troubleshooting guide or reach out on the Railway Discord.