Metrics
Railway provides resource usage information on deployments within a service, which can be used to diagnose issues with a project's performance.
How it works
For each service, Railway captures metric data. These metrics are then made available in graphs within a service's panel, under the metrics tab.
Accessing service metrics
Access a service's metrics by clicking on a service in the project canvas, and going to the "Metrics" tab.
Provided metrics
The following metrics are provided:
- CPU - Processor usage
- Memory - RAM consumption
- Disk Usage - Storage utilization
- Network - Inbound and outbound traffic
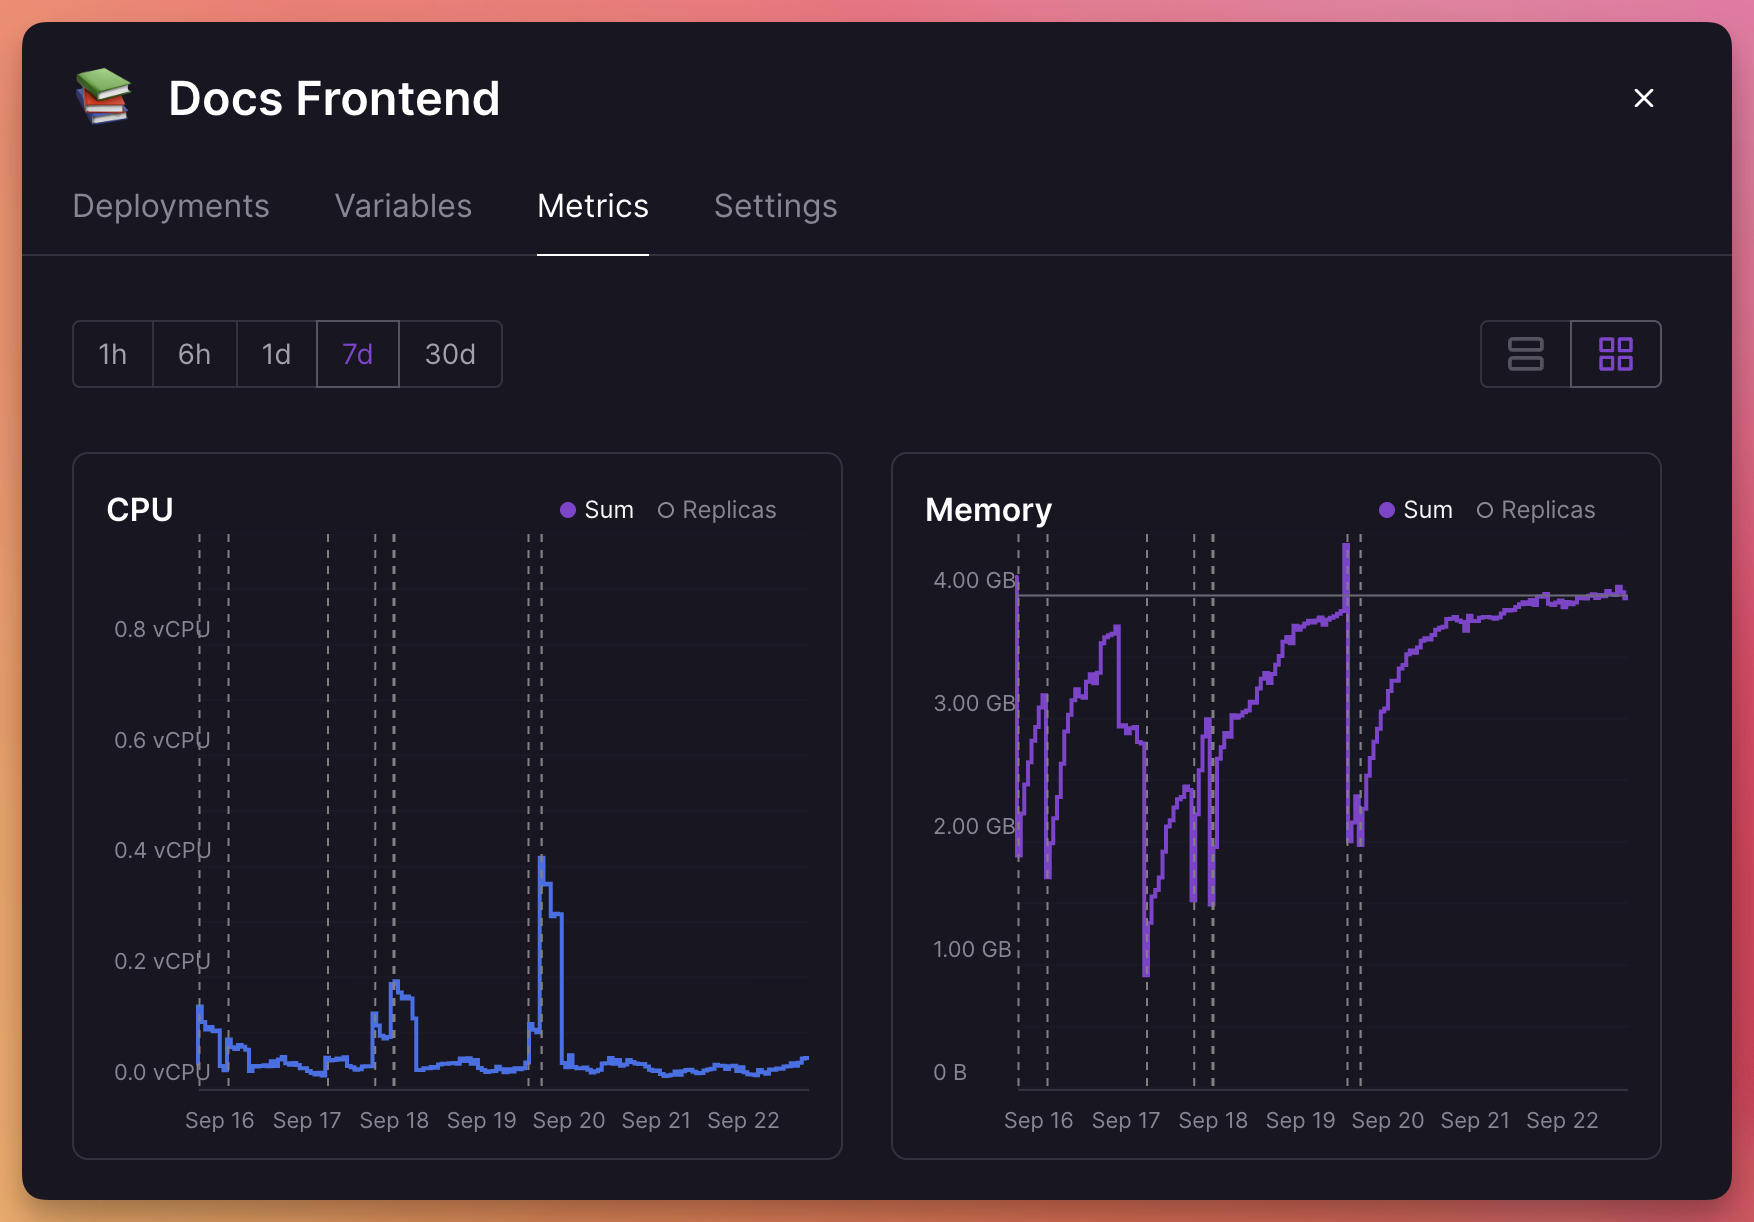
Understanding the metrics graphs
Graphs include dotted lines to indicate when new deployments began. Up to 30 days of data is available for each project.
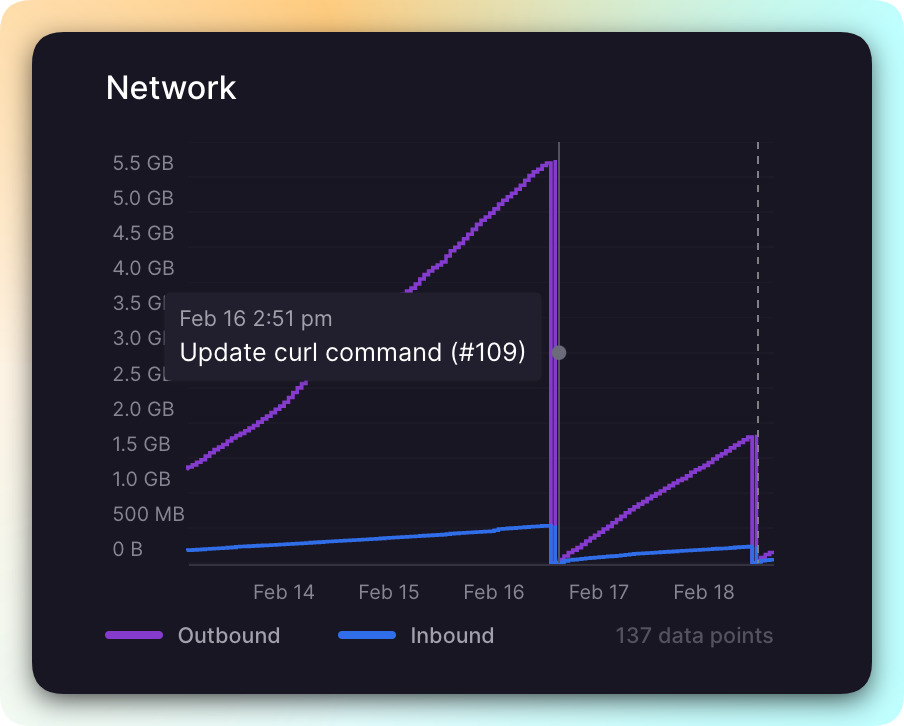
Projects maintain a continuous time-series for all deployments within a service, not just the latest one. Deployments appear on the graph so users can see which commit may have caused a spike in resources.
Metrics with multiple replicas
When a service runs multiple replicas, you can view metrics in two ways: Sum or Replica.
Note: Public network traffic metrics are only available in the Sum view.
Sum view
In Sum view, metrics from all replicas are combined. For example, if you have two replicas using 100 MB of memory each, the metrics tab will show 200 MB.
Replica view
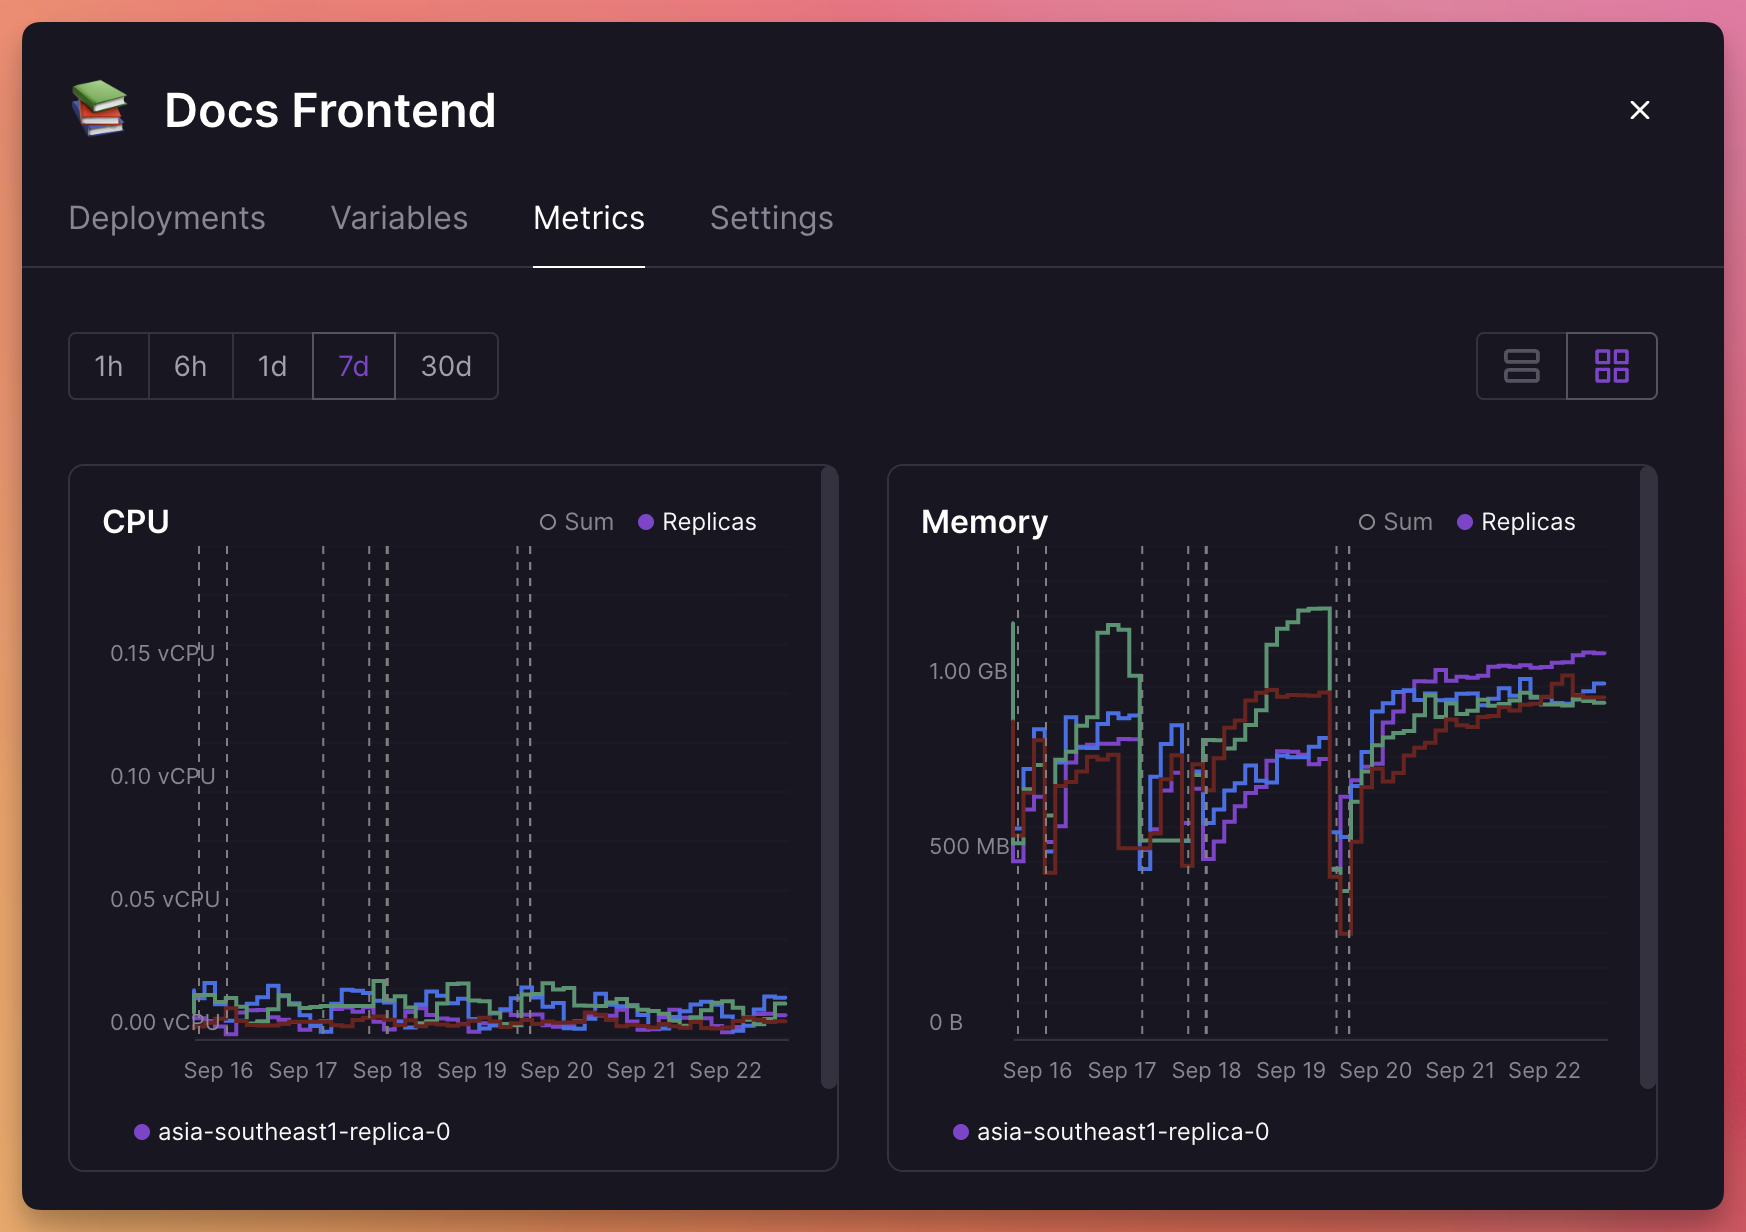
In Replica view, you can see metrics for each replica individually. This is useful for diagnosing issues with specific replicas or spotting if some regions are under- or overutilized.
The total from all replicas may differ slightly from the Sum view due to rounding or overlapping instances during zero-downtime deployments.
Troubleshooting
Having issues understanding your metrics? Check out the Troubleshooting guide or reach out on the Railway Discord.